Junior Studio – Infographic & motion graphic
Spring 2020
Infographic: Visual and Motion Graphics
Project Overview
Visualization of data is important in quickly seeing patterns or trends in vast amounts of complex information. Using design principles, it is possible to encode large amounts of data that can be easily interpreted by the target audience. It is the designer’s responsibility to enhance the presentation of the information in a meaningful way. This means the data should be legible, systematic, and logical in its form and content. The designer should be careful to avoid needless graphics or distortion of the facts. The shape, format, style, color and meaning all have precedent on what and how information can be portrayed.
Learning Objectives
• Research and assess information on the subject assigned
• Graphically represent data with regard to types of data and changes over time
• Create an information design in which data can be accessed in a variety of ways or formats
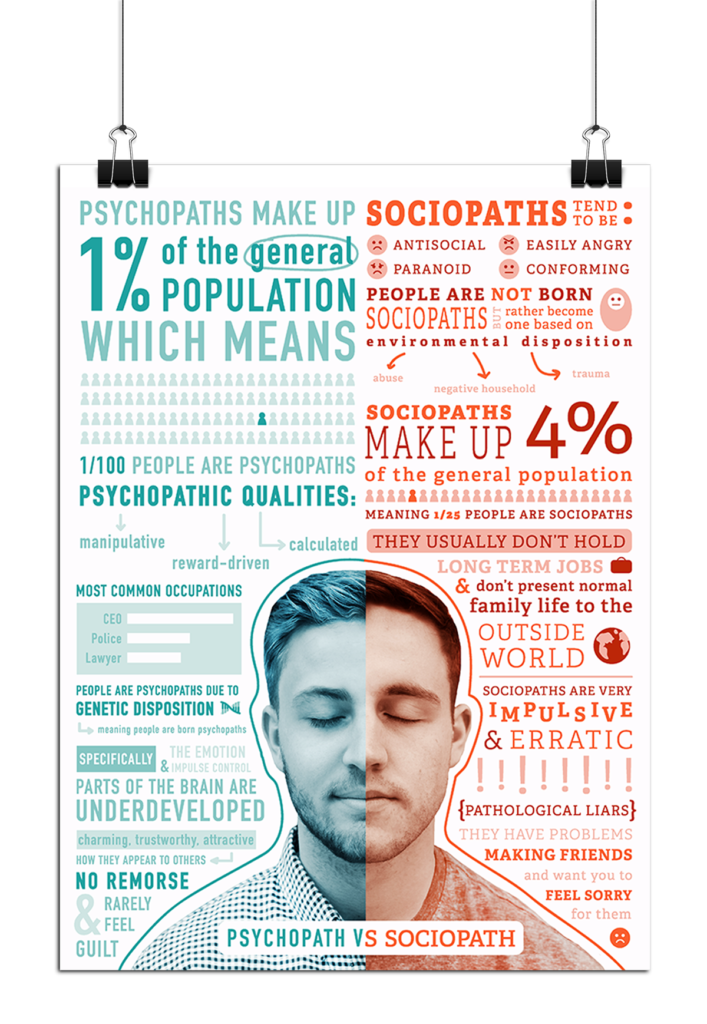
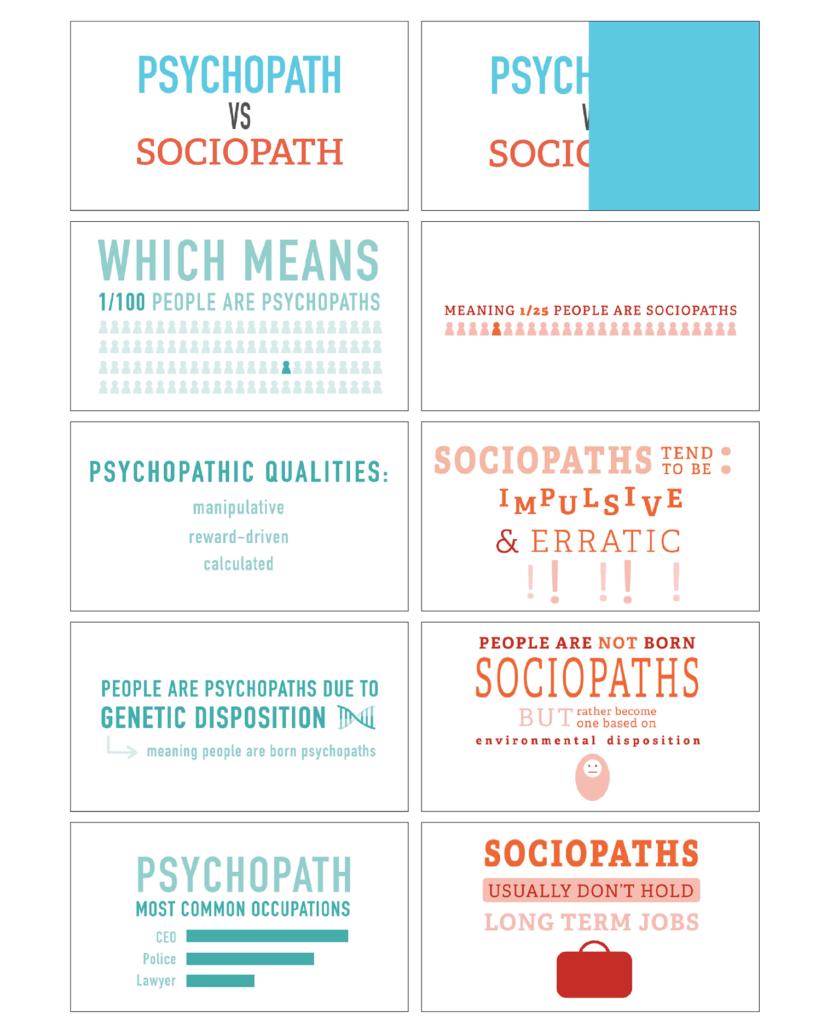
Psychopathy vs. Sociopaths
Link for the motion graphic of Psychopathy vs. Sociopaths:
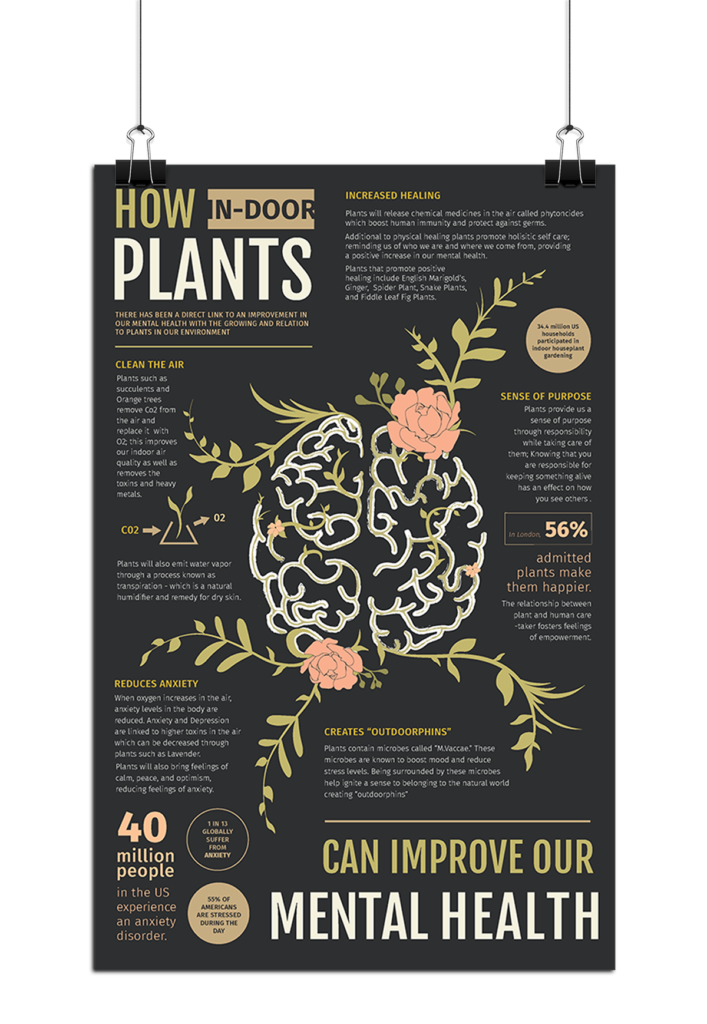
How Plants Improve Our Mental Health

Link for the motion graphic of How Plants Improve Our Mental Health:
How to Play Ukulele and How It Makes You Happy

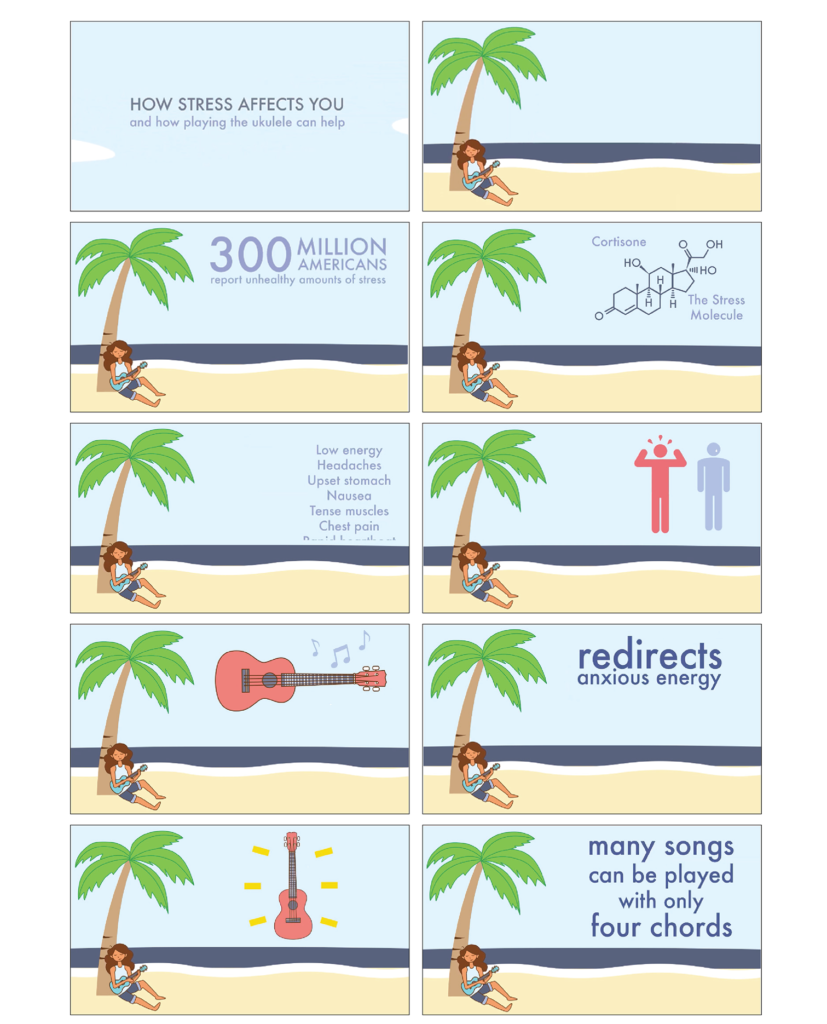
Link for the motion graphic of How to Play Ukulele and How It Makes You Happy:
A Bunny’s Guide
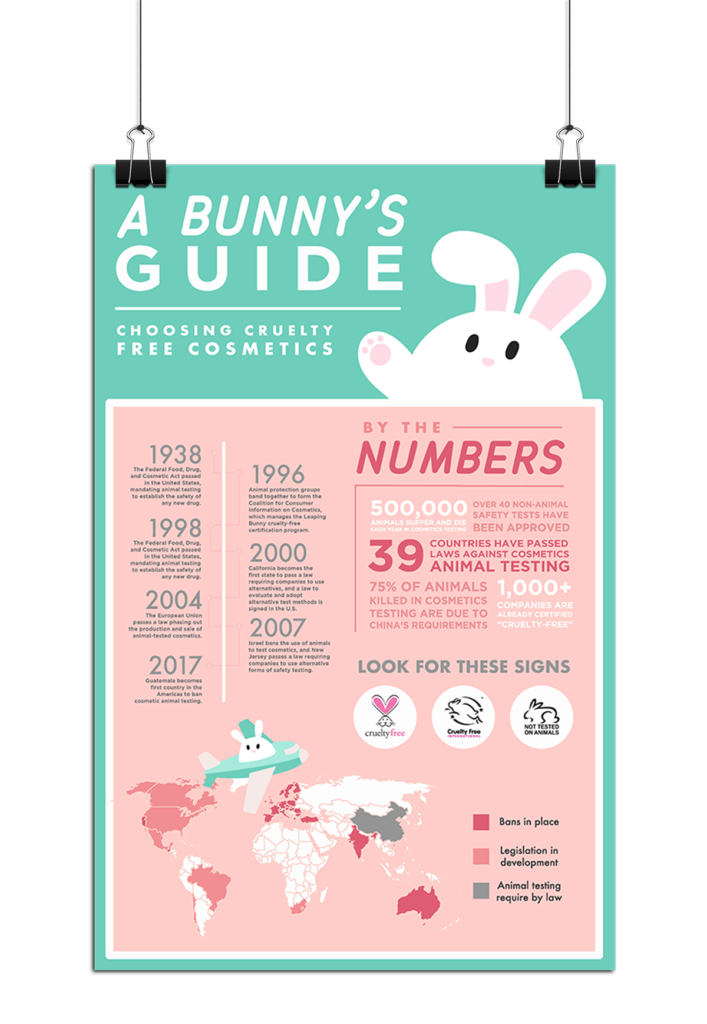
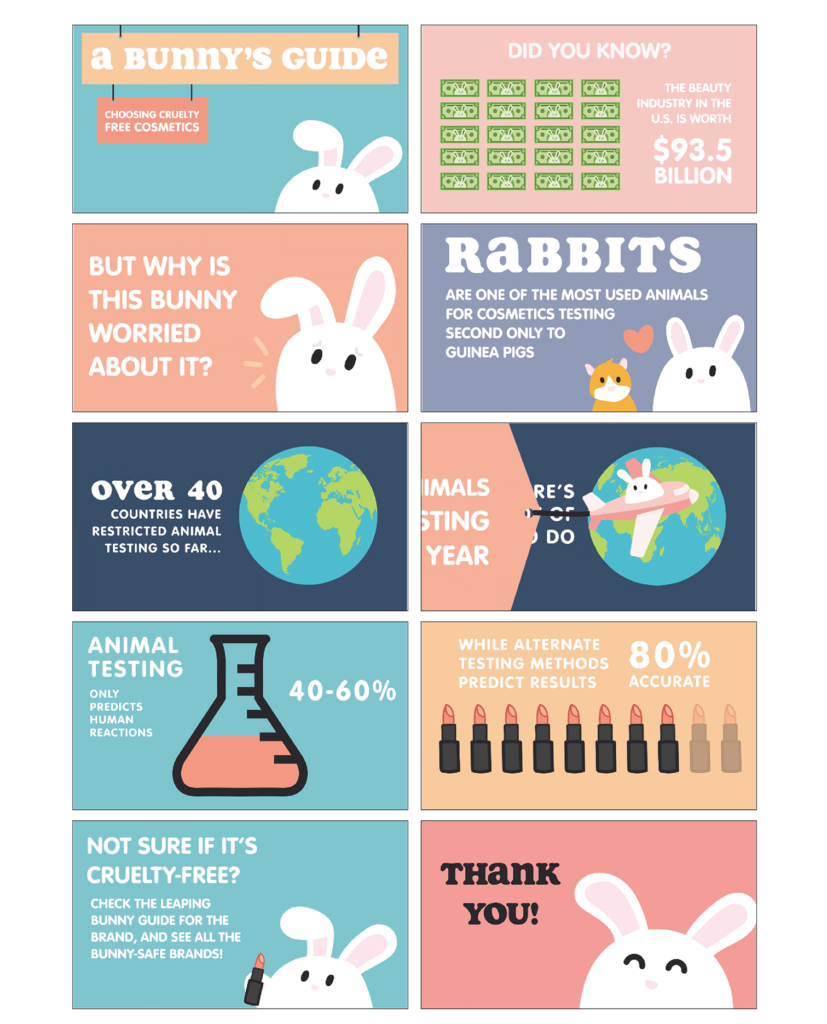
Link for the motion graphic of A Bunny’s Guide:
Hypothyroidism


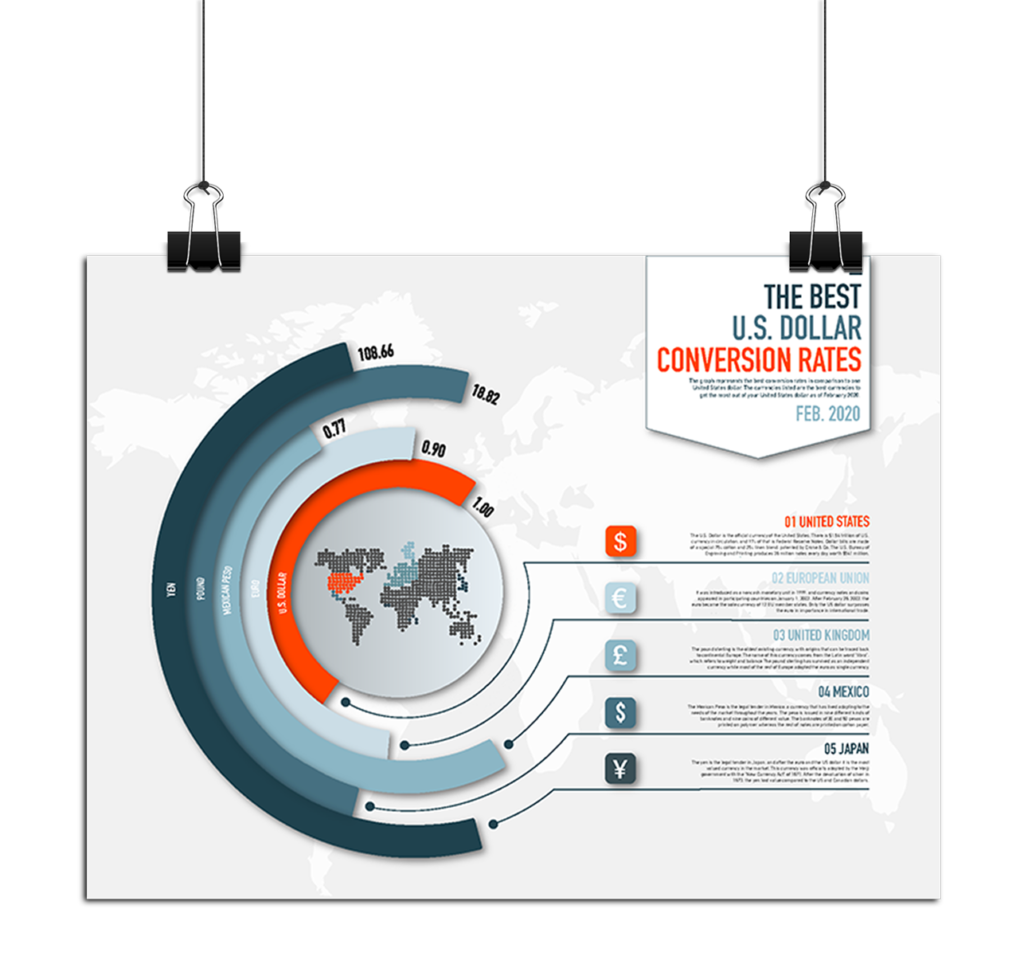
The Best US Dollar Conversion Rates